Increasing ingestion throughput while reducing Cloud Spanner cost
At Mixpanel, we ingest more than 1 trillion events per month. Operating a large-scale distributed system that handles such a high event volume is challenging partly because multiple issues interacting with each other can make pinpointing root causes very difficult. In this blog post, we will walk you through how we root caused and fixed sources of high latency in our ingestion pipeline, ultimately increasing our ingestion throughput and reducing our cost.
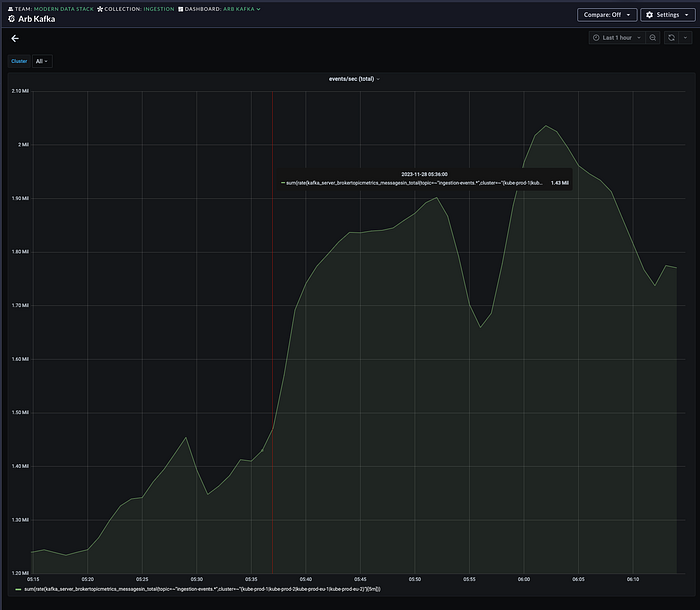
Since the completion of this project, the number of events we ingestion per second continues to reach new highs.

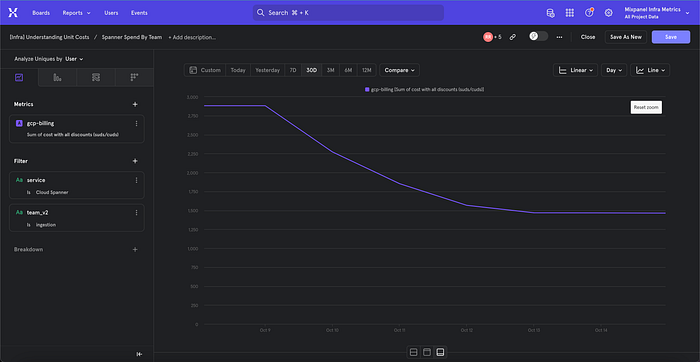
At the same time, our Cloud Spanner cost continues to decline.

Background
At a high level, when ingesting an event, Mixpanel transforms the distinct ID of the event to its canonical ID before processing further. We do this to make sure that all events belonging to the same canonical ID will eventually be routed to the same cluster. To map a distinct ID to a canonical ID, customers can use the Identify APIs to provide the mapping. We then store the mappings in a table in Cloud Spanner and, when ingesting an event, we use the internal LookupAndUpdate API to retrieve the mapping and transform the distinct ID of the event. In addition to returning the mapping, LookupAndUpdate also updates the oldest event date of the mapping so that we can bound the range of events to retrieve for a given ID.
Motivation
In 2023, as we looked for ways to cut cost, we found that Cloud Spanner was one of our higher cost centers with seemingly extra capacity. The recommended Cloud Spanner CPU utilization is 65%, and our Cloud Spanner CPU utilization was consistently between 20% and 40%. Initially, to get better utilization, we tried reducing the number of Cloud Spanner nodes directly. However, we quickly reverted the change when latency spiked and ingestion was delayed. Yet it was hard to attribute spike in latency solely to CPU utilization because CPU utilization was significantly below the recommended 65% during those periods. Originally, we suspected the reason for the spike in latency was due to lock contention inside Cloud Spanner from concurrent mutations. However, this didn’t explain all the latencies we were seeing. Therefore, we concluded that there might be multiple contributing factors and decided to make the system more predictable first.
Cloud Spanner Lock Contention
We started with our initial suspicion — lock contention. Upon further investigation, we confirmed that during periods of high latency, the lock wait time inside Cloud Spanner was often quite high. Using Lock Insights (https://cloud.google.com/blog/products/databases/introducing-lock-insights-and-transaction-insights-for-spanner), we further discovered that the row keys where the lock conflict occurred were all in the same table.

We then realized that this was because two of our APIs (LookupAndUpdate and Identify) were trying to write to entire rows in the table, even though the columns they were updating were different. Although Cloud Spanner locks can work at the individual column level, we were passing in the entire struct to the mutations API spanner.InsertOrUpdateStruct. This has the unnecessary effect of always writing to the entire row even when only a few columns were changed.
To limit row updates to only the columns that were changed, we needed to keep track of the changes. One way to do that was to keep or retrieve an original copy, compare each column, and then only write the columns that were changed. Keeping an original copy in the struct means we will double the memory usage, while retrieving an original copy means we will double the API calls.
Another way was to privatize all the fields in the struct and only allow the fields to be updated through their respective setter methods, keeping track of the changes through the setter methods. This involved more code changes but the result would be more efficient and transparent, which was what we decided to implement. Following is a sample code example of how we track changes and update Cloud Spanner with only those changes:
func (r *Record) IdentifySeenChanged() bool {
 return r.identifySeenChanged
}

func (r *Record) GetIdentifySeen() bool {
 return r.identifySeen
}

func (r *Record) SetIdentifySeenToTrue() *Record {
 if !r.identifySeen {
  r.identifySeen = true
  r.identifySeenChanged = true
 }

 return r
}

func newIdentityRowChangedColumnsOnly(rec *identity.Record) (row map[string]interface{}, hasChanges bool) {
 in := make(map[string]interface{})
 if rec.MixpanelIDChanged() {
  in["mixpanel_id"] = nullStr(rec.RawMixpanelID())
 }
 if rec.EarliestSeenChanged() {
  in["earliest_seen"] = nullTime(rec.GetEarliestSeen())
 }
 if rec.PeopleUpdateSeenChanged() {
  in["people_update_seen"] = nullBool(rec.GetPeopleUpdateSeen())
 }
 if rec.IdentifySeenChanged() {
  in["identify_seen"] = nullBool(rec.GetIdentifySeen())
 }
 if rec.AliasSeenChanged() {
  in["alias_seen"] = nullBool(rec.GetAliasSeen())
 }

 if len(in) == 0 {
  return nil, false
 }

 in["distinct_id"] = rec.GetDistinctID()
 in["namespace_id"] = rec.GetNamespaceID()
 in["namespace_type"] = rec.GetNamespaceType()

 return in, true
}

func (s *Spanner) updateRecordsUsingMutations(
 ctx context.Context,
 txn ReadWriteTransaction,
 records ...*identity.Record,
) error {
 if len(records) == 0 {
  return nil
 }

 var mutations []*spanner.Mutation
 for _, rec := range records {
  if rec.GetIsSynthetic() {
   return errRecordIsSynthetic
  }

  mutation, hasChanged := newIdentityRowChangedColumnsOnly(rec)
  if hasChanged {
   mutations = append(mutations, spanner.UpdateMap(IngestionTable, mutation))
  }
 }

 return txn.BufferWrite(mutations)
}
Bottlenecked on metrics exporter
After fixing the lock contention inside Cloud Spanner, we found that there were still occurrences of ingestion delay. Upon examining the block profiles, we found that the delay was because of a bottleneck in our metric exporter (metrics.)
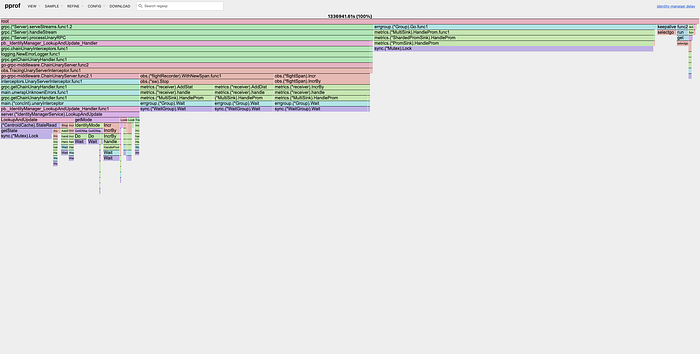
For context, we had recently migrated from Wavefront to Chronosphere. As part of the migration, we added a dependency on statsd_exporter (https://github.com/prometheus/statsd_exporter), which was doing the metric transformations from StatsD-style metrics to Prometheus metrics. This was problematic for a high throughput system because there was only a single channel, so all goroutines that were trying to export metrics were competing for that channel. And because there was only a single consumer on the other end of the channel, when the channel buffer became full, the goroutines were all blocked.
Thanks to and our #devinfra team, we consolidated the generation and exporting of metrics into a single goroutine. By using a reference to the metric object itself (and only creating one if none already exist) and applying updates to the object using atomic operations, we only use the write lock when creating the metric object for the first sample. After that, we only need the read locks to check if the object exists, which will not lead to lock contention.
Results
Once we fixed those two root causes by refactoring our code and deploying the fixes, we were able to confidently lower the Cloud Spanner nodes again and confirm that no spike in latency or delay in ingestion happened as a result.
Soon after, we started processing 2 million events per second, which was an all-time high for us.
We also saved close to 50% of our Cloud Spanner cost by simply lowering the Cloud Spanner nodes.
Conclusion
When debugging systems, multiple issues can interact with each other making the root causing difficult. By making a distributed system more predictable, we can be confident in our changes that not only increase throughput but also reduce cost.
If working on problems like this interests you, join us!

